Research >
Economic Indicators Dashboard
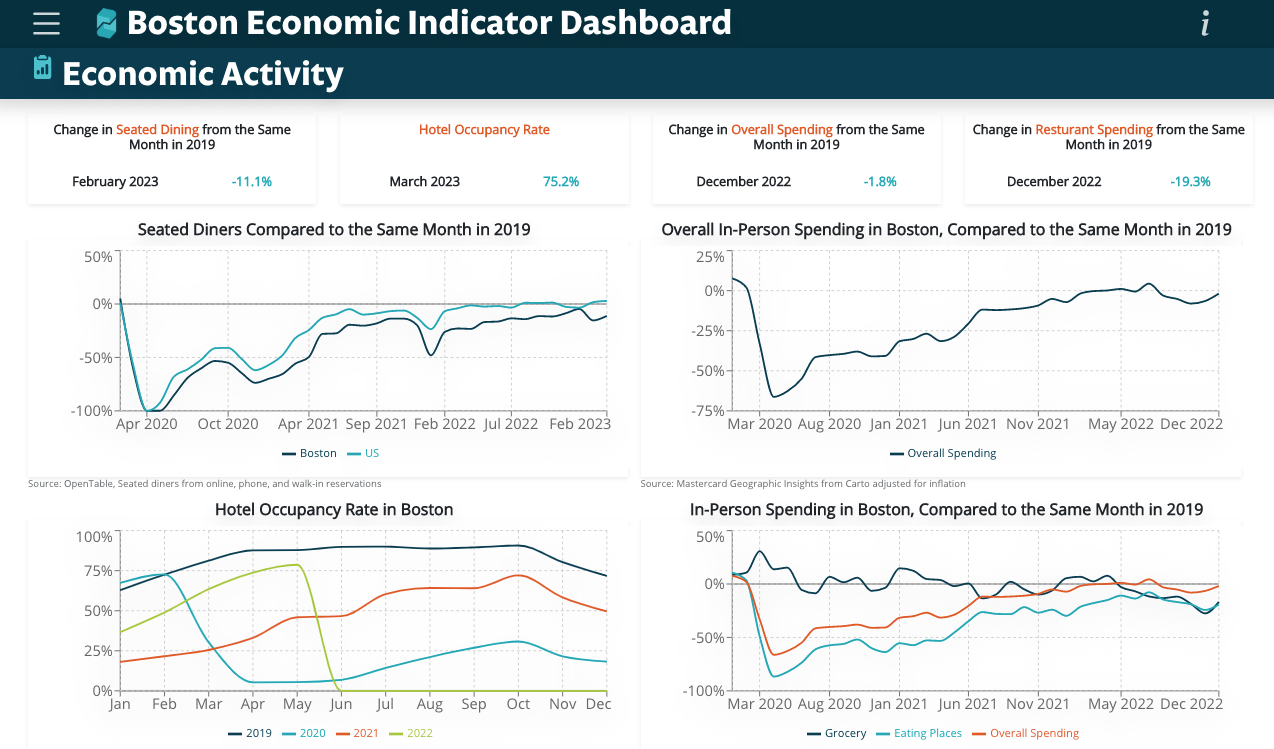
This Economic Indicators Dashboard is a joint project of the Research Division and the GIS Lab. It provides monthly data updates to track Boston’s economy in five areas: Labor Market, Mobility, Economic Activity, Real Estate Market, and Real Estate Development. In addition to citywide data for each of these five topic areas, the dashboard provides profiles of each of Boston’s four commercial hubs: Fenway/Longwood, Back Bay, Downtown, and South Boston Waterfront.
View the dashboard